Toronto Real Estate Analysis 2012 - 2022
At the end of last year, I looked into the data from the last 10 years from every suburb in the city where I sell in Australia, Brisbane, the 2032 Olympic city. You can check that out here. One of the key findings was that units/townhouses have been going up much slower than houses. It was normal for houses to have gone up by 50% or more over the decade while it was abnormal for units to have gone up by more than 30% and potentially even 20%.
Unfortunately for us, our datasets aren’t broken down as well as yours in Toronto. Units and townhouses are all bundled in together, which likely leads to lower growth numbers. Still, the gap in growth is clear.
As it turns out, that trend doesn’t necessary hold up for Toronto, or at least in the same magnitude, as shown in the growth data below (which I’ve interpreted from TREB data).
A couple of key things jump out to me here. 905 has been growing faster than 416 and semis and townhouses have the highest average growth numbers, although detached houses have the highest highs and lowest lows when it comes to growth. The slowest growth of any housing type was 127% for condos in the 416, which means that even condos have been a good investment over the last decade. That’s not true here. They may have had good yield, but not good capital growth here in brisbane.
The most interesting thing for me is that condos exhibit similar average growth with lower volatility than detached houses (9.1% VS 10.1% in 416 and 11.1% vs 12.8% for 905 - looking at the middle table). This may not be all that interesting for you but I can see the pricing gap broadening between detached houses and units in Brisbane and, considering that, prices in Toronto were similar in 2012 at $830,000 for a detached house.
It’s my expectation that a lack of affordability has lead to a trickle down in purchase preference from Detached to Semi to Townhouse to Condo in Toronto. What’s interesting is that growth is fairly similar over the 10 year period for each of these housing types. What that potentially means for Brisbane is that, if house prices become increasingly unaffordable, eventually townhouses and condos (units) catch up and look like increasingly better investment opportunities.
So, what does all this mean in a rising interest rate environment? Well, the below graph tells the story.
It’s clear that interest rates have had an impact on prices in the past including an increase of 76 basis points in 2018 which lead to -14.3% reduction in detached house price. Also, a reduction of 56 basis points lead to growth of 36.8% in 2021. So far in 2022, there has still been strong growth of approximately 15% but it will be interesting to see how much higher interest rates will go and what effect this will have on prices considering how much the pandemic has lead to people scrambling for the right home to suit their needs.
The above slide shows the considerable increase in price across all housing types over the period with all increasing by over 100% over the 10 year period.
The above slide shows the increase in pricing gap over time with semis staying fairly flat over the period with about 10% difference in gap while the gap more than doubled for both townhouses and condos. Interesting, the gap between townhouse and detached house is now actually larger than the price of a detached house in the 416 in 2012 (OVER $800,000). Note that the graphs work in sync with the lines never crossing - condos never became more valuable than a townhouse etc.
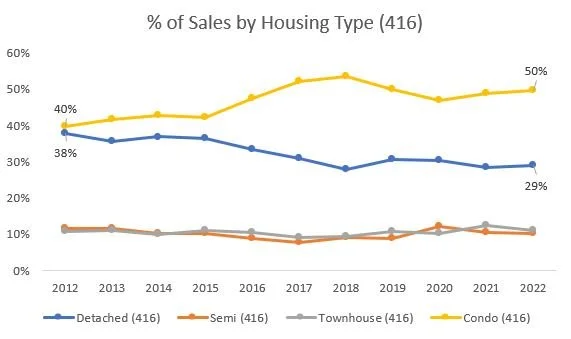
This is where the data starts to get interesting - there is a significant decrease in the number of detached homes being sold (blue line) since approx 2017, although 2021 was a strong year in a buoyant market. It seems that detached houses became more tightly held over time as prices continued to increase and perhaps there was a fear that you couldn’t easily get back into the market if you were to sell.
This is shown more clearly by the chart above with detached houses moving from 38% to 29% of sales while condos made up the difference with a corresponding 10% increase in sales.
At the same time, semis and townhouses appreciated against the price of detached houses over the period moving to 77% and 56% respectively.
What’s also interesting to note is that 905 prices appreciated against 416 prices meaning that 905 detached housing shifted from 70% of the 2012 price of 416 to 78% of the 2022 price. This was a consistent trend across all housing types with prices becoming increasingly similar as people likely became more willing to live outside of the 416, even before this became a key trend during the pandemic. Again, it’s likely that affordability played a key role.
This graph shows the significant price growth over the period across all housing types. As shown again below, 905 prices grew faster than 416 for all housing types with between 149% to 182% growth over the period, a gap of between 17% to 29% growth over the 10 year period with Semis showing the highest growth and condos showing the lowest.
The above image shows the widening price growth over time with the gap doubling or more for all housing types when compared to detached houses.
This is also shown above in relation to the % of the detached house price that it costs to buy the product. Condos went down slightly while townhouses and semis both went up slightly.
In the 905, there was also a reduction in the number of detached houses sold over time.
This is shown in percentage terms with a decrease from 60% to 55% over time for decreased houses as a percentage of sales. Again, condos made up the difference (yellow line).
The biggest takeaway I took from this analysis is that, once detached prices are elevated to a level that is unaffordable, the remaining housing types become more and more appealing. So much so that long term growth numbers become similar over time.
Also, once the inner city becomes unaffordable, there will become a time when the highest growth is seen outside of the city, as can be seen here.
Neither of these trends exist yet in Brisbane but it will be interesting to see if we become a higher growth, higher demand city as we inch closer to the Olympics in 10 years from now. Below are the growth tables again for Toronto for reference.
You can learn more about the Brisbane market on my home page, www.andoandco.com or watch the below video for a full breakdown of what’s been happening over the last decade in Brisbane, before we were announced as the 2032 Olympic City.
I hope this has been helpful in some way. Feel free to give me a call via WhatsApp on +61 424 682 636 or email me at chris@purere.com.au.


