

How has Brisbane performed in comparison to the South East Queensland Market?

Published July 22, 2023
Plenty of people love living in Brisbane, although, until recently, the Brisbane property market grew more slowly than some of Australia’s larger cities. Now, after the Olympics announcement and the Covid growth spurt, Brisbane’s development is in full swing and the city is becoming more attractive to interstate and international investors and migrants.
This article considers how the Brisbane market has compared against the Gold Coast, Sunshine Coast and Toowoomba over the last decade. Hopefully, after reading this report, you’ll have a better understanding of which location will be best for your future investment or home purchase.
Specifically, this article will compare price growth & number of sales across all capital cities for both houses and units as well as median household income and median household mortgage repayments for each city. This will allow us to consider previous growth, current sales activity as well as overall affordability across all markets.
Key Points
Brisbane, Gold Coast, Sunshine Coast and Toowoomba all saw a strong uplift in house and unit prices after the announcement of covid in 2020;
All cities also experienced an uplift in the number of sales over the same period (2020 - 2022);
FY2023 saw a sharp decrease in the number of sales, which is most likely as a result of increasingly higher interest rates from April 2022 onwards;
Sales volumes for most cities are now close to their lowest point over the last decade;
The 4% increase in interest rate since April 2022 has increased mortgage repayments and reduced affordability for prospective buyers across Australia; and
Brisbane remains an affordable option for both houses and units, especially when considered against median household income for the city
House Price Growth
The graph and table below considers price growth for the housing market across all cities.


“Average annual growth rate (AAGR) is the average annualized return of an investment, portfolio, asset, or cash flow over time.” Investopedia
*All data sourced from Pricefinder and the Australian Bureau of Statistics and all analysis, interpretations and potential errors are my own.
As we can see from the data above, the Gold Coast & Sunshine Coast have both grown significantly faster than Brisbane and Toowoomba. Median prices on both coasts have both more than doubled over the decade with 133% growth for the Gold Coast and 110% for the Sunshine Coast versus 72% for Brisbane and 59% for Toowoomba. This equates to almost 10% growth per annum for the Gold Coast versus 6.2% for Brisbane over the decade. If you have a look at the Australian report, you’ll also see that the Gold Coast has grown faster than Sydney and Melbourne over this period.
Now, the good news about this is that prices remain more affordable in Brisbane, which is great for owner occupiers. Unfortunately it’s also made that potential move to either coast more expensive in retirement.
Unit & Townhouse Price Growth
So, what about the unit and townhouse market? The below graph and table tell the story.


*Unfortunately, Pricefinder groups units and houses together in the data so there’s no way to assess any difference in trends.
The good news for retirees is that the median unit price at the Gold and Sunshine Coasts remains lower than the median house price in Brisbane, however the margin is close to $100,000. Prices haven’t quite doubled over the decade at the coasts, although it’s fairly close with 93% growth for the Sunshine Coast. Interestingly, unit prices grew faster on the Sunshine Coast over the last 5 years than house prices in Brisbane. In numbers, this equates to 11.4%/annum for the Sunshine Coast units versus 9.3% for Brisbane houses with Gold Coast units close behind at 9% average annual growth between 2018-2023.
What’s really interesting is that the graphs crossed lines over the decade for units. Brisbane units were more valuable until about 2016/2017 and Brisbane unit prices actually dropped in price between 2016 to 2021 while the median unit prices at both coasts kept growing. Looking at the numbers more closely, Toowoomba also outgrew Brisbane over the decade at 3.2%/annum for Toowoomba versus 2.4%/annum for Brisbane.
House Sales Volume
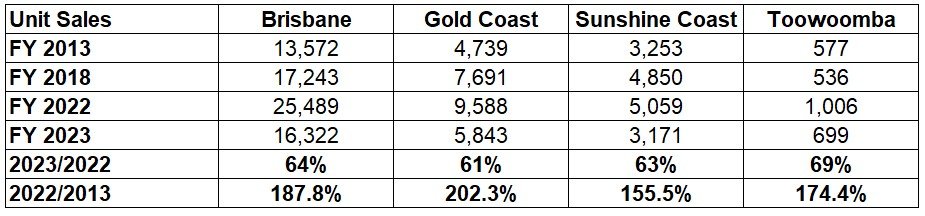
So, it’s all well and good to know the price growth, but how many sales actually occur each year? Well, more sales occur in the Brisbane market each year than the three other markets combined in most years, as below.
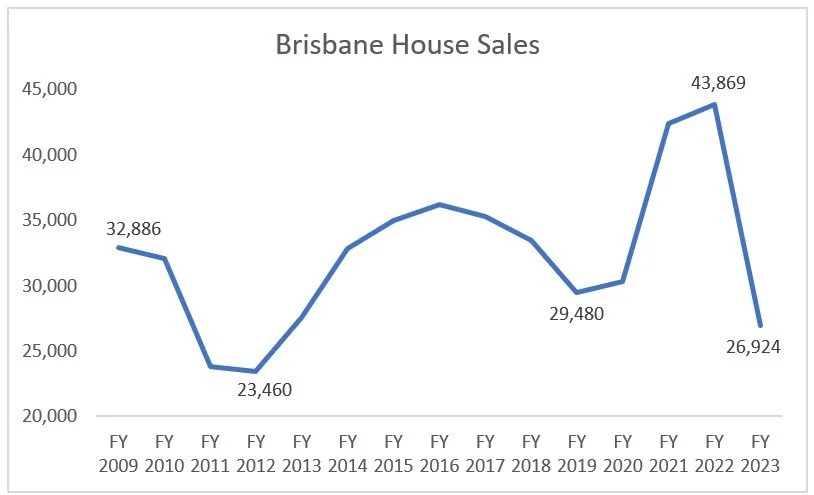


As you can see from the figures above, there was a large spike in the number of sales in 2021 & 2022, although 2023 saw big drop-off in the number of houses transacted. In numbers, the 2022 figure was between 133-159% of the 2013 figure while the 2023 number was between 61-70% of the 2022 sales figure. For Brisbane, that meant that sales spiked to 43,869 houses in 2022 versus 26,924 in 2023, which was less than the 27,549 figure for 2013 which was when the market was recovering from the delayed effects of the Global Financial Crisis but still more than the low in 2012 of 23,460, which was the worst year post GFC. So, how can we explain what happened to the housing market over these two periods?
The Effect of Interest Rates on the Housing Market
When you look at the RBA’s cash rate target data below, you can see that the market conditions are fairly similar for the 2008 - 2010 period as we’ve seen from 2018 - 2023 with a drop followed by a spike in rates, although we’ve seen a much larger increase in rates over the last year while there was a bigger drop post GFC. In figures, this was a drop from 7.25% in August 2008 to 3% in April 2009 then a spike to 4.75% in November 2010. Looking back at the graph for Brisbane’s number of sales, 2009 was a strong year (32,886) followed by a drop leading into 2011 & 2012 where the number of sales dropped to 23,460 in 2012.
Looking at the situation now, we moved from 1.5% in May 2019 to 0.1% in November 2020 until April 2022 when rates started increasing up until now to 4.1% in June 2023. During FY2023, we also saw drop in sales volume to 61% of the 2022 figure for Brisbane and 62% for the Gold Coast.
The 4% increase between 2022 - 2023 of is almost as much as the 4.25% drop in 2008-2009, although our current rate of 4.1% is still lower than the 4.75% spike in 2010. Historically, 4.1% is lower than any cash rate target pre-2009 for Australia, although this rapid increase in rates has still severely impacted household expenditures for those with a mortgage, which was approximately 3.3 million households across Australia in 2021, according to the ABS.

Unit & Townhouse Sales Volume
So, how did it look for units and townhouses? Well, the Brisbane trend is very similar as we saw for houses with a low of 10,539 in 2011, post GFC, followed by a spike in 2022 to 25,489, followed by a drop to 16,322 in 2023. The below table further analyses the data.


When comparing the years, the drop in sales between 2023 & 2022 is very similar as it was for houses with between 61% to 69% (versus 61-70% for houses), although the 2022 spike was more pronounced at 155% to 202% (versus 133-159%) in comparison to the 2013 year. It would be interesting to consider whether this may have been due to the spike in investors selling their units over the 2020 - 2022 period or also because units became an increasingly attractive purchase for first time home buyers as houses became more expensive. Either way, there was a large spike in the number of sales for units in 2022 that tracked the trend for houses.
The shape of the graph for units sales was fairly similar for Brisbane, Gold Coast & Sunshine Coast although the 2015-2016 peak for Brisbane may have been more pronounced due to all the development activity at the time. Fortunately for Brisbane investors, the covid spike in demand lead to the 2022 median unit price spiking above the previous 2016 high of $441,500 to hit $460,000 in 2022 then $483,000 in 2023.
Now, we’ve already considered house prices, number of sales and interest rates but the final two metrics for us to consider is the difference in median household income and median household mortgage expenditure across the cities, which I was able to check on the ABS website, as below.

*The ABS data was recorded in 2021 and is the most recent data available at this stage.
Looking at the data above, Brisbane’s median household income is over 20% higher than the Gold Coast, Sunshine Coast and Toowoomba at $107,536 versus $87,932 for the Gold Coast, $81,848 for the Sunshine Coast and $79,972 for Toowoomba. Looking at the relationship between median mortgage repayments and median family income, Brisbane’s mortgage repayments make up the lowest percentage (23%) versus 27% and 28% for the Gold Coast and Sunshine Coast.
Given that interest rates have increased by 4% between 2021 & 2023, mortgage repayments have potentially increased by 50% or more so I’ve created a 50% uplift scenario (shown in grey) to check the effect of interest rate rises on this metric. Under this scenario, all figures are over 30% with the Gold Coast and Sunshine Coast the highest at 40% and 42% respectively. These are similar percentages to what was seen in Sydney (40%) in the Australian report. This shows that households in Toowoomba, the Gold Coast & the Sunshine Coast markets may be more affected by interest rate rises than in Brisbane. If you’d like to check how your repayments could be affected by interest rate rises, use the below calculator from Loan Market.
So, as we’ve seen, the last five years has been the highest growth period for both units and houses across these four cities. The Gold & Sunshine Coasts have been growing faster than Brisbane for both units and houses and there’s been a large drop-off in sales activity over the last 12 months for all markets to the magnitude of 60-70% of 2022 sales. Based on RBS cash rate data, this has all happened before when interest rates have dropped then spiked suddenly between 2008- 2010, although the difference we see now is that all homeowners that purchased pre-2020 have likely seen a large spike in the value of their home or investment property due to the long period of near zero interest rates and global economic expansion post-covid.
So, could FY 2024 be the right time to sell? Well, the good news is that we still have plenty of buyers looking for the right property to hit the market so there’s still plenty of competition among buyers to enable you to secure a strong price for your property. Feel free to reach out to me on 0424 682 636 or chris.andersen@raywhite.com if you’d like to discuss further.
If you’re looking to buy in Brisbane, the below video from December 2021 shows:
the high and low growth suburbs across Brisbane over the last decade;
the affordable areas to buy a house;
an overview of the unit and townhouse market; and
the skills you need to learn to speak with agents and close deals faster and more easily.
I've now switched to Ray White since this video was recorded so my email address has changed to chris.andersen@raywhite.com
If you’re looking to buy or sell in this market and you’d like some further assistance, feel free to reach out at 0424 682 636 or chris.andersen@raywhite.com