
How has Brisbane performed in comparison to other Australian Capital Cities?

Published July 22, 2023
Plenty of people love living in Brisbane, although, until recently, the Brisbane property market grew more slowly than the likes of Sydney and Melbourne. Now, after the Olympics announcement and the Covid growth spurt, Brisbane’s development is in full swing and the city is becoming more attractive to interstate and international investors and migrants.
This article considers how the Brisbane market has compared against the heavy hitters of Sydney, Melbourne, Canberra and the other capital cities over the last decade. Hopefully, after reading this report, you’ll have a better understanding of which location will be best for your future investment or home purchase.
Specifically, this article will compare price growth & number of sales across all capital cities for both houses and units as well as median household income and median household mortgage repayments for each city. This will allow us to consider previous growth, current sales activity as well as overall affordability across all markets.
Key Points
Most of Australia’s capital cities, including Brisbane, saw a strong uplift in house and unit prices after the announcement of covid in 2020;
Most cities also experienced an uplift in the number of sales over the same period (2020 - 2022);
FY2023 saw a sharp decrease in the number of sales, which is most likely as a result of increasingly higher interest rates from April 2022 onwards;
Sales volumes for most capital cities are now at or near their lowest point over the last decade;
The 4% increase in interest rate since April 2022 has increased mortgage repayments and reduced affordability for prospective buyers across Australia; and
Brisbane remains an affordable option for both houses and units, especially when compared to the larger cities of Sydney, Melbourne and Canberra
House Price Growth
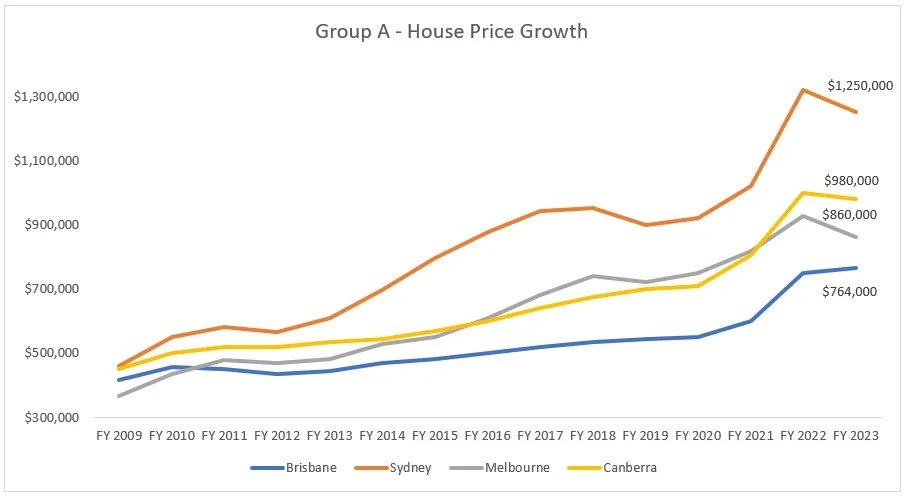
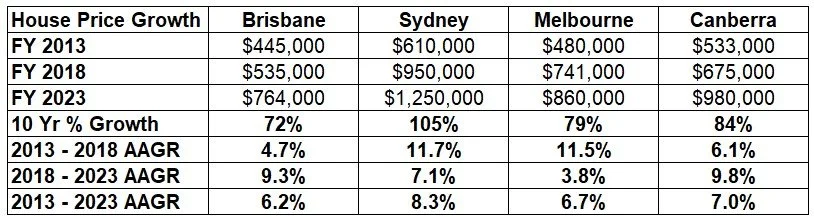
The graph and table below considers price growth for the housing market. For ease of viewing, I’ve split cities into two groups, as below.
A - Brisbane, Sydney, Melbourne & Canberra
B - Hobart, Adelaide, Perth & Darwin
“Average annual growth rate (AAGR) is the average annualized return of an investment, portfolio, asset, or cash flow over time.” Investopedia
*All data sourced from Pricefinder and the Australian Bureau of Statistics and all analysis, interpretations and potential errors are my own.
As per the data above, Sydney was the standout performer over the past decade with 105% median price growth over the decade and the median price of $1,250,000 is now worth over 60% more than Brisbane ($764,000). Looking at the growth profiles, however, both Sydney and Melbourne saw the majority of their growth pre-2020 with 11.7% & 11.5% annual growth for Sydney and Melbourne respectively over the 2013-2018 period.
As we know, Melbourne had a difficult time during covid and growth was slowed during 2018-2023 at 3.8% versus 9.3% for Brisbane and 9.8% annual growth for Canberra. While Brisbane has had strong recent growth, it remains affordable compared to the 3 other large capital cities. Still, there are more affordable options in other states, as below.


Looking at the graph above, it’s interesting to note that the two most valuable cities at the start of the period (Perth & Darwin) finished as the least valuable with Hobart coming from behind and achieving 115% growth over the period. Looking across all capital cities, Hobart actually grew significantly faster over the 2018 - 2023 period (14.3%/annum) than the second placed city, Canberra, at 9.8%/annum. Perth and Darwin were both relatively flat over the period and are now the two most affordable capital cities to buy a house in Australia. Interestingly, the Gold Coast actually grew faster than Hobart over the decade with more detail available in the South East Queensland Report.
House Sales Volume
So, it’s all well and good to know the price growth, but how many sales actually occur each year and how big are the respective markets? For ease of viewing, the graphs below are split across 3 groups.
Brisbane, Sydney, Melbourne
Canberra, Hobart & Darwin
Perth & Adelaide

Brisbane, Sydney & Melbourne all followed a similar trend, although Sydney and Melbourne’s 2023 sales numbers were the lowest over the period, while Brisbane’s sales were lower in 2012, post GFC (23,460 in 2012 vs 26,925 in 2023).

Perth’s market is a fairly similar size to Brisbane, although saw a lesser drop in sales in 2023 and much less price growth. Like Brisbane, Adelaide’s 2023 number of sales (16,056) is close to its 2012 low (14,450).
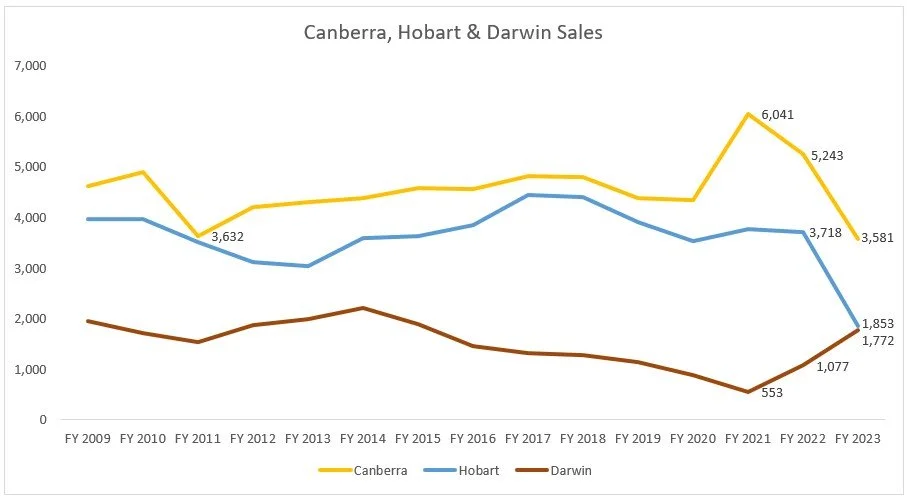
Canberra and Hobart both hit new lows in terms of number of sales in 2023 (3,581 & 1,853) while Darwin hit its low in 2021 (553) and has seen significantly more sales over the last few years (1,772 in 2023).

Looking at the drop in sales numbers between 2023 & 2022, all of the cities above sat in the range of 61% - 68%, although when it comes 2023 vs 2013 figures, Brisbane was an outlier at 159.2% versus between 114.7% to 121.8% for the remaining cities. This would suggest that the covid spike was higher in Brisbane, although Sydney spiked in 2021 at 66,528 which was 168.3% of the 2019 figure of 39,521. This compares to 147% for Brisbane between the 2022 number of 43,869 and the 2019 figure of 29,480. Looking at the graph, it’s clear to see that Sydney was also coming off a larger dip in sales in 2019.

Looking at the data above, Hobart has seen the most significant drop in sales between 2023 & 2022 at 50% while Darwin bucked the trend and had a rapid growth of 165% since 2022, mainly because of the period of low sales since 2021. This figure is further explained in considering the difference between Darwin’s 2022 number and 2013 at 53.9%, indicating much almost half the number of sales in 2022 as was seen in 2013. In comparison, all other cities were between 107.6% and 131.6%. So what’s the easiest way we can explain the changes in sales figures and prices?
The Effect of Interest Rates on the Housing Market
When you look at the RBA’s cash rate target data below, you can see that the market conditions are fairly similar for the 2008 - 2010 period as we’ve seen from 2018 - 2023 with a drop followed by a spike in rates, although we’ve seen a much larger increase in rates over the last year while there was a bigger drop post GFC. In figures, this was a drop from 7.25% in August 2008 to 3% in April 2009 then a spike to 4.75% in November 2010. Looking back at the graph for Brisbane’s number of sales, 2009 was a strong year (32,886) followed by a drop leading into 2011 & 2012 where the number of sales dropped to 23,460 in 2012.
Looking at the situation now, we moved from 1.5% in May 2019 to 0.1% in November 2020 until April 2022 when rates started increasing up until now to 4.1% in June 2023. During FY2023, we also saw drop in sales volume to 61% of the 2022 figure for both Brisbane and Sydney. For Sydney, Melbourne, Canberra & Hobart, FY2023 was the lowest sales volume recorded over the last decade.
The 4% increase between 2022 - 2023 of is almost as much as the 4.25% drop in 2008-2009, although our current rate of 4.1% is still lower than the 4.75% spike in 2010. Historically, 4.1% is lower than any cash rate target pre-2009 for Australia, although this rapid increase in rates has still severely impacted household expenditures for those with a mortgage, which was approximately 3.3 million households across Australia in 2021, according to the ABS.

Unit & Townhouse Price Growth
So, how did it look for units and townhouses? The graphs and tables below tell the story and are split into two groups.
Brisbane, Sydney, Melbourne & Canberra
Hobart, Adelaide, Perth & Darwin


*Unfortunately, Pricefinder groups units and houses together in the data so there’s no way to assess any difference in trends.
Looking at the graph, unit prices for all cities were fairly similar in 2009, with the range between $355,000 for Brisbane & Melbourne and $387,000 for Sydney. By 2013, Brisbane had just surpassed Sydney’s 2009 figure at $390,000 but Sydney had streaked away to $525,000. Sydney continued this strong growth of 8.4%/annum between 2013-2018 to hit $725,000 in 2018 but both Sydney and Melbourne slowed down to 0.5% and 1.7% growth per annum respectively between 2018-2023. Canberra was the highest growth city over the decade at 49% with Brisbane at less than half (24%) and Sydney and Melbourne in between at 41% and 36%. These growth figures were approximately half of what we saw for houses for each respective city over the period, although Brisbane’s unit growth was 1/3 the figure for houses (24% vs 72%). So, what about the other cities?


Hobart experienced the strongest growth with 102% over the decade versus 49% for Adelaide and a drop in prices for both Perth and Darwin of -6% and -9% respectively. Yet again, we saw Perth and Darwin’s median unit prices drop below Hobart and Adelaide’s prices. Adelaide’s median price is now worth almost exactly the same as Brisbane ($485,000 vs $483,000) while Hobart’s units were actually worth 143.2% of Darwin, 137.5% of Perth & 113.4% of Adelaide when considering the respective median prices for each city. In comparison, Sydney is worth 134.5% of Hobart’s median price and 153.2% of Brisbane’s median price.
Unit & Townhouse Sales Numbers
So, what about sales numbers? The graphs and tables below tell the story and are split into two groups.
Brisbane, Sydney, Melbourne
Canberra, Hobart, Adelaide, Perth & Darwin

Looking at the graph above, Sydney and Melbourne both experienced a significant dip in sales heading into 2019, like what we saw with houses. Melbourne’s 2023 figure of 26,828 was the lowest number of sales over the period while Sydney’s figure of 30,006 is less than half of the peak that was experienced in 2015 of 64,691.

Perth was the standout here with a significant increase in sales heading into 2022 and minimal drop-off in 2023. Canberra saw a large drop from 2021 to 3,392 sales in 2023 which was close to the previous low of 3,376 in 2009. Adelaide has been on a fairly consistent upward trend since 2012 and, although sales dropped in 2023, the 7,450 figure was higher than 2020’s figure of 6,577. The tables below show the numbers in more detail.

Looking at the data above, Brisbane and Canberra experienced the largest spike in activity in 2022 at 187.8% & 176.3% of the 2013 numbers, although Canberra also experienced the largest drop in activity for 2023 at 55% of the 2022 number. In comparison, Brisbane, Sydney and Melbourne were all between 64% - 67% of their 2022 sales figure in 2023. This compares to the 57% - 68% range we saw for houses for the four capital cities.

Looking at the figures for Adelaide, Perth and Darwin, the range was between 79% - 96% for 2023/2022. Hobart, on the other hand saw a sharp drop in sales to 55% of the 2022 number in 2023. For a small market with only 635 sales in 2023, this would likely have made a big impact and may have contributed to keeping prices high for the very high growth city. This compares to Perth where sales growth has been very strong from 2020-2023 while prices have remained stagnant.
Income & Affordability
Now, we’ve already considered house prices, number of sales and interest rates but the final two metrics for us to consider is the difference in median household income and median household mortgage expenditure across the capital cities, which I was able to check on the ABS website, as below.

*The ABS data was recorded in 2021 and is the most recent data available at this stage.
Looking at the data above, Sydney’s median household income is slightly higher than Brisbane at $108,004 and Canberra is over 16% higher than both Brisbane and Sydney at $125,788. Canberra’s mortgages also make up the lowest percentage of income at 21% while Sydney is 27%.
Given that interest rates have increased by 4% between 2021 & 2023, mortgage repayments have potentially increased by 50% or more so I’ve created a 50% uplift scenario (shown in grey) to check the effect of interest rate rises on this metric. Under this scenario, all figures are over 30% with Sydney and Melbourne the highest at 40% and 36% respectively. This shows that households in those markets may be more affected by interest rate rises than Brisbane or Canberra.

Looking at the smaller markets, it’s interesting to note that Darwin has a higher median household income ($114,688) than all capital cities except Canberra with $125,788. These cities have mortgages that make up 24% or less of median household income which is similar to Brisbane at 23%. Still, under the 50% uplift scenario, Adelaide and Perth are expected to experience more mortgage stress than Brisbane at 35% versus 34% in Brisbane. This shows that Brisbane is in a reasonably good position when it comes to affordability but higher interest rates will put all capital cities into mortgage stress at over 30% of median household income. If you’d like to check how your repayments could be affected by interest rate rises, use the below calculator from Loan Market.
Conclusion
Looking back over the report, you’ll see that most markets experienced a dip in sales in FY23 compared to FY22, including Brisbane, although prices in Brisbane for both houses and units are the highest they’ve ever been in FY2023. Units in Brisbane ($483,000) remain more affordable than all capital cities except Perth and Darwin while houses in Brisbane ($764,000) are more affordable than Sydney ($1,250,000), Melbourne ($860,000) and Canberra ($980,000). All of this makes it clear why we’re seeing so much interstate migration into Brisbane and South East Queensland.
If you’re considering selling in this market, it’s clear to see that there’s still very limited stock available for buyers which means there’s plenty of competition for you to achieve a high price for your property. Feel free to reach out to me on 0424 682 636 or chris.andersen@raywhite.com if you’d like to discuss further.
If you’re looking to buy in Brisbane, the below video from December 2021 shows:
the high and low growth suburbs across Brisbane over the last decade;
the affordable areas to buy a house;
an overview of the unit and townhouse market; and
the skills you need to learn to speak with agents and close deals faster and more easily.
I've now switched to Ray White since this video so my email address has changed to chris.andersen@raywhite.com
If you’re looking to buy or sell in this market and you’d like some further assistance, feel free to reach out at 0424 682 636 or chris.andersen@raywhite.com